Probably anyone interested in the stock market saw the sculpture of Italian sculptor Arturo Di Modica in New York on Wall Street. It’s a powerful bull sweeping away everything in its path. No less popular on the market…
and the image of an angry bear. So who are they and what do they mean? Today we will talk about the main symbols of the stock market.
A BULL OR A BEAR?
Bulls are buyers of securities trying to make money on the rise in asset value.
Bears are bidders who make money on a falling market. If the market is dominated by asset buyers who are waiting for their growth to sell, and stock indices are growing for a long time, this market is commonly referred to as “bull”.
For example, the current bullish trend of the US stock market started in March 2009. At that time, the S&P 500 index was at the level of 667 points and by September 2018 (for nine and a half years) had grown by 340%. On September 21, 2018, the index reached a historical peak of 2,941 points!
From 1903 to 2016, the S&P 500 index moved 12 periods of the bull market. The average duration of these periods was just over eight years with an average yield of 387%. The average bearish trend lasted 1.5 years, and losses were 35%. It would seem, nonsense, one can wait and survive. But is it worth experimenting? After all, everyone remembers the 1929 stock market crash with its terrible consequences for human destiny and the economy. They remember the collapse of high-tech companies. And 2008, I’m sure everyone remembers it very well. In Japan, the bear market stretched out for 20 years.
THE BULL AS A TREND OF ETERNAL GROWTH…
The growing bullish trend is usually based on cyclical economic growth, contributing to the growth of companies’ profits and dividend payments, which ultimately affects the valuation of assets. The reasons for the cyclical upward trend may vary from period to period.
In general, the bull market lasts much longer than the bear market – as the population and economy grow. More people mean more savings to be invested, and because capital historically offers higher returns than bonds, stock markets attract more of these funds and grow over time.
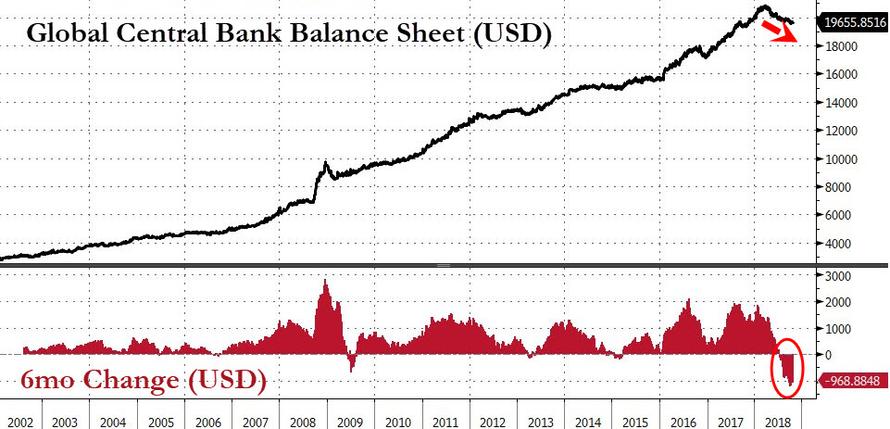
The average bull market since 1927 is about 1000 days. The most common market in history, from 1987 to early 2000, was 4494 days. The current rising trend is already over 3000 days and will be record-breaking if it continues until June 2021. It should be noted that the non-stop rally of American indices, observed since 2009, is basically quite unhealthy due to the active participation of world central banks. It is the Federal Reserve, the ECB, the Central Bank of Japan and the Central Bank of China that are to blame for significant price distortions.
and the ubiquitous bubbles in the market.
BEAR – FALL PHASE
Growth is always followed by recession and depression. Periods of bull and bear markets change each other, differing in duration.
and the amplitude of the fluctuations: the longer good times last, the more confident investors become. However, sooner or later securities quotations are falling, and general pessimism leads to negative self-confidence. While investors expect losses in the bear market and sales continue, the pessimism only grows and turns into panic. It is believed that a fall of more than 20% in the Dow Jones and S&P 500 indices in at least two months means entering the bear market.
One of the brightest examples of the bear market is considered to be the recession of 1973-1974, when the market decline reached 59% and it took 48 months to recover. In 1987-1988, the decline was 35%, and the recovery then took 20 months. In 1998, the fall was 29% and the market recovered in just 2 months. The latest bear markets on Wall Street in 2000-02 and 2007-09 caused the S&P 500 to collapse by more than 45% and 50% respectively.
WHAT’S HAPPENING TODAY
Experts and analysts define the current state of the American economy as a mature (or late) phase of growth in the economic cycle.
As growth in the U.S. economy becomes more mature, investors’ concerns about the decline in global growth, exacerbated by trade war, tightening monetary policy and disasters in emerging markets – may be a turning point that will cause another, new bear market.
Overall, October 2018 was the worst month for the stock market since 2011. The S&P 500 fell 6.9%, although the Nasdaq index showed the biggest decline after the 2008 disaster. After the bounce, the downward movement is likely to continue. And there are reasons for that. For example, Bank Goldman in its preliminary review for the 3Q urged investors to focus on how the market will respond to three problems in 2019:
- Raising tariff rates
- Tough labour market
- The rise in the cost of debt. This is the most significant factor based on the historically high global debt values at present.
The global economy is becoming increasingly vulnerable to the global debt crisis, while the global quantitative easing is not.
hasn’t done too much debt to address the underlying problem. Instead, it only made the problem worse – the inevitable collapse could play out in the markets as soon as there is a long-term “point of no return” caused by the rising cost of money, that is, interest rates.
Take the example of the U.S. federal government, which has not only accumulated another $10 trillion in debt since the crisis, but also has “hidden obligations” on its balance sheet in the form of social security programs. In the past, the debt crisis was limited to countries
with an emerging market such as Argentina. Today, large developed countries like Italy are already showing signs of tension, as their populist government hopes to increase the country’s budget deficit, adding more debt to what Italy already has the third largest debt to GDP in the developed world.
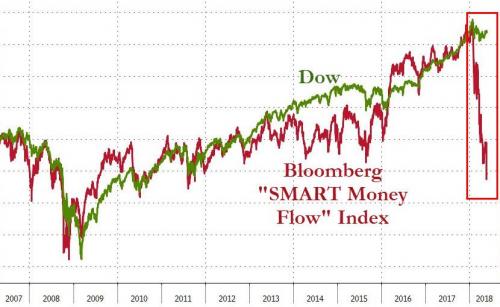
Previously, inflation was the universal solution to debt repayment. But the problem with inflation, as was the case in the U.S. in 1970, is that if inflation starts to develop, it is no longer controllable. The biggest achievement of many QEs is the transfer of credit risk from individuals and companies to the government. And now that interest rates are starting to rise, everyone, without exception, will have to pay a high price for all these levers. The current economic growth in the U.S. certainly seems undeniable and sustainable, but the next recession could manifest itself as early as late 2019-20. One indicator of future instability is the dynamics of the so-called “smart money” index.
So, soon we will see a grand battle of bulls and bears in the market.
By the way, there are other images to characterize players in the market:
Sheep are cowardly or cautious. Long defined with a choice: buy or sell.
Sheep – try to make money on small fluctuations in rates by buying and selling assets within one trading session.
Pigs – greedy players. They hold a profitable position until the very last moment, even when the general trend in the market has already changed.