To obtain a satisfactory financial result with the lowest risk, you need to distribute your assets wisely. Distribution of assets is your decision on how, where and in what proportions you will invest your capital, even if it will be one thousand dollars. A fundamental analysis will help you. And about that in today’s article.
There are only 4 factors that determine how successful or unsuccessful your investment is:
The choice of specific stock market instruments and securities.
Shares, bonds, futures, etc.
Investment horizon with entry and exit points.
That is to say, a known definition of the moment when you will withdraw your funds.
The cost of the investment process.
Different costs during the investment planning process.
Using fundamental analysis in asset allocation.
Forecasting the market value of a company based on its financial and operational performance.
Portfolio formation based on fundamental analysis is done using two methods:
The first is the “Top-down asset allocation” forecasting method, in which analysts first carry out country analysis, then create economic forecasts for a country as a whole, then for individual industries, and finally for specific companies.
FORECASTS FOR INDUSTRIES ARE BASED ON FORECASTS FOR THE ECONOMY AS A WHOLE,
AND FORECASTS FOR COMPANIES ARE ON INDUSTRY FORECASTS.
The second is the top-down method. When companies are first to assess the prospects of individual companies, they then make a forecast of the prospects for their industries,
and then for the economy as a whole. In practice, a combination of the two approaches is often used. But I’m closer to the first one, so more about it.
The method of “Top down asset allocation” includes three levels:
The first level – analysis of the state of the economy as a whole. It allows us to find out how favorable the overall situation is for investment. Instability at the macroeconomic level can affect the expected return and higher risk, even for a well-diversified portfolio. First of all, GDP growth rate and public debt level are analyzed.
A real example: The U.S. ranks first in terms of debt size, but not in terms of debt to GDP ratio.
The US public debt is over $21.5 trillion – 31.8% of all central government debt.
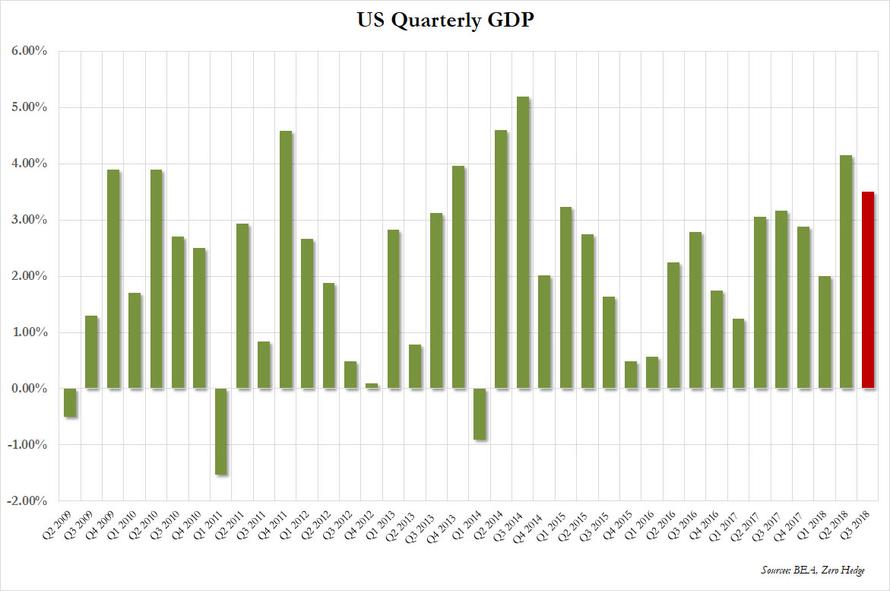
But the U.S. economy is still growing steadily. The U.S. annual GDP in 2017 was $19.3 trillion.
In the 3rd quarter of 2018, it grew by another 3.5%.
But the national debt of Italy is 131% of GDP, or $1.9 trillion, while the growth rate is constantly deteriorating.
WHEN CONDUCTING FUNDAMENTAL ANALYSIS, PAY ATTENTION TO THE DYNAMICS OF UNEMPLOYMENT AND INFLATION,
GOLD AND FOREIGN CURRENCY RESERVES, DYNAMICS OF DOMESTIC INTEREST RATES AND THE NATIONAL CURRENCY RATE
The second level – the choice of industries of interest to the investor. It is carried out by studying the data on the state of affairs in the industry based on the use of classifiers of the industry by the level of business activity and stages of development. For the fundamental analysis at this stage all branches conditionally divide into growing, stable and cyclic.
The third level is the assessment of the issuer. At this stage, they study the financial and economic situation of the company for several recent years, the efficiency of management of the company and predict the prospects for its development.
The fundamental analysis is based on the data of annual and quarterly reports of the company, materials of general meetings of shareholders and public speeches of the company’s executives, research of specialized organizations of stock market participants, for example, rating agencies’ assessments. At the same time, the indicators of the company’s capital structure, profitability indicators, and indicators of the company’s own ratio are calculated.
and debt capital, dividend and profit per common share, market price to profit per common share, book value, etc.
There are a huge number of tools available to study the past, current or future economic situation in a country or individual company. For convenience, they have been defined as indicators that are categorized as leading, coinciding and lagging.
Forward-looking indicators. Consider economic development in the future with some time ahead of schedule. An example of such macroeconomic indicator is the ISM index, which characterizes the production and trade activity in the economy, or, for example, the percentage change in money supply. Moreover, we can say that the stock market itself is a leading indicator in relation to the main economic indicators.
Lagging indicators. They are used to measure and evaluate events that have already happened. This category includes the ratio of consumer debt to personal income, prices of consumer goods, inflation, short-term and long-term interest rates.
Indicators of the current state of the economy. Indicators show the level of production capacity utilization or more general statistical information about production, orders and revenues.
Thus, on the basis of the analysis of a set of fundamental indicators it is possible to find out the general direction of movement of different asset classes, to estimate macroeconomic situation, attractiveness of industries and dynamics of investment activity. This means that we can properly distribute our own assets.