Low volatility allows managers to increase position limits.
Or vice versa – high volatility forces managers to reduce market positions in order to minimize risk.
TYPES OF VOLATILITY IN THE MARKET
There’s more than one.
Historical volatility (HV, Historical volatility) – estimation of volatility based on data for a certain period, which determines how fast the price has changed in the past. The most common method of its calculation is the standard deviation.
Implying volatility (IV, Implied volatility) – characterizes the future value of this indicator and is determined based on the current price of the asset.
Comparison of historical and implied volatility allows to estimate,
whether the market value of the asset is justified, overestimated or underestimated.
In practice, one rule works: if there is a situation when implied volatility is low relative to the historical one, one should expect it to rise and return to “normal” levels. Therefore, in this case it will be justified to create long positions on this instrument. When implying the volatility is higher than the historical one and there is a high probability that it should decrease – you should sell and open short positions.
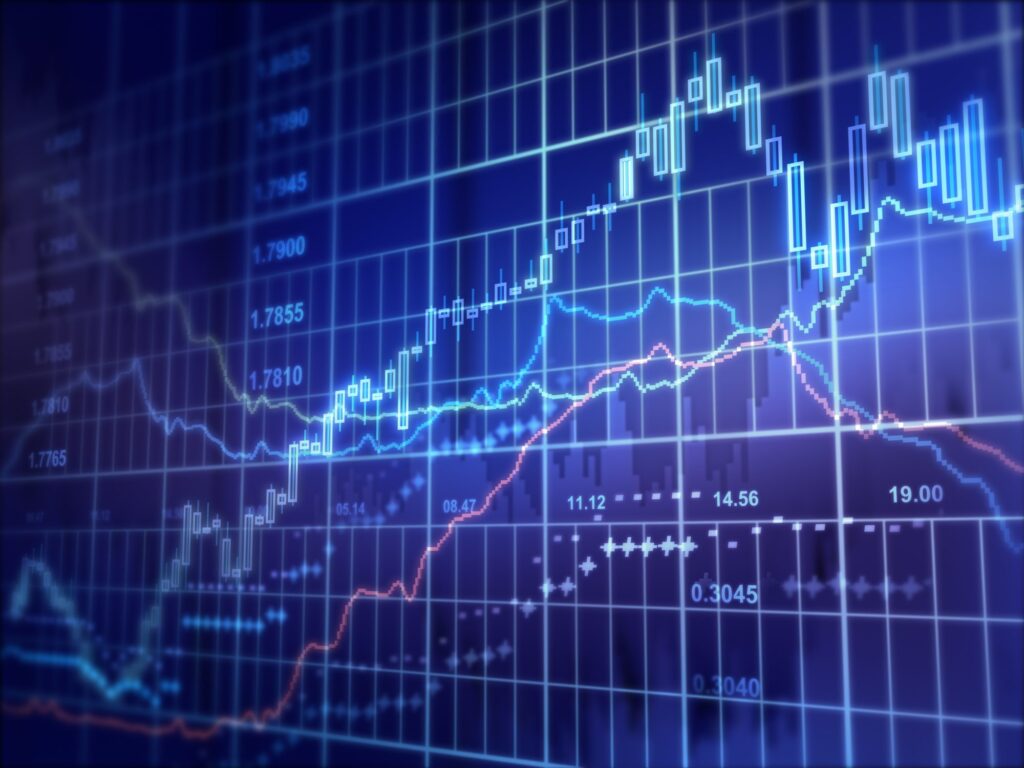
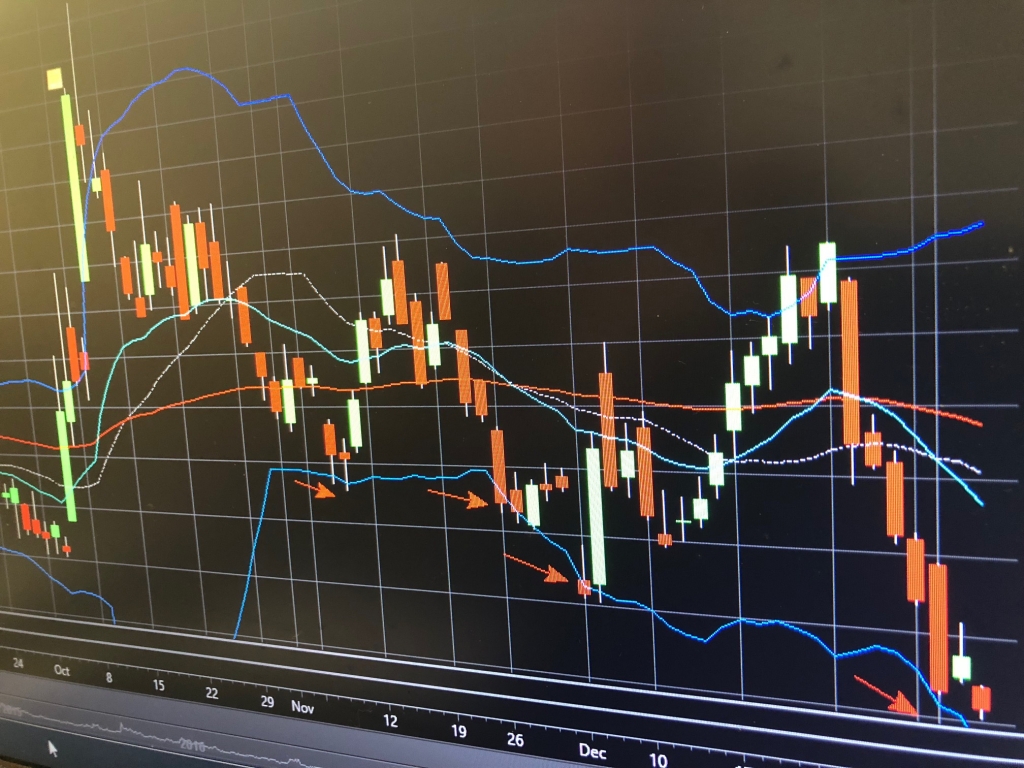
In technical analysis, there are special tools that calculate the price volatility, the amplitude of its fluctuations, which allows you to make the right decision to buy or sell an asset.
For example:
Average True Range (ATR) – a simple indicator that shows the average current maximum and minimum value of a financial instrument price. To apply it, for example, a daily chart of an asset is opened, to which ATR data are applied: if the variability is high – the indicator grows, if it is low – falls.
Volatility Average Single High Limit – this indicator allows using several indicators (single average and increased average volatility) to assess the market condition.
Bollinger Bands – when volatility reflects the volatility of the asset value with a limited range of price fluctuations.
Notis – measures the volatility of the market by the difference between the maximum and minimum price. It is designed not only to measure volatility, but also to determine the phases and directions of the trend.
WHICH DETERMINES THE VOLATILITY
Two factors.
The expectations of market participants. For example, the growth of volatility can be observed after the statement of the heads of central banks about the changes in the market economy.
in monetary policy.
Current state of the economy. If we observe stable economic growth, it means that volatility in the market is low by historical standards. If there is a crisis, it means the volatility indicators are vertical.
Now the volatility indicator VIX, or “fear index”, as it is also called, is at a very low level. But market participants ask numerous questions: “When to wait for a trade deal between China and the USA?”, “Where can the global economy get a new impulse for growth?”, “Is a crisis possible in China or will there be a controlled slowdown in growth?”, “What growth is expected in the USA, EU, Japan, Russia?
in 2019?” And so on. There is no answer to any of the questions, which means there is no certainty, and we should expect more volatility this year.
The main idea of volatility trading is to play on its future changes using appropriate tools. There are a number of instruments traded on the Nasdaq that are linked to the VIX index. Such as UVXY US, TVIX US, VXXB US, VXX US. As an example, let us consider the last instrument in more detail.
iPath S&P 500 VIX ST Futures ETN (VXX)
Recall that options for the S&P 500 index show the expectations of market participants – traders open positions for the growth or decline of the market. The VIX index calculated on their basis shows the expected volatility, i.e. the degree of change in the prices of shares included in the S&P 500 index.
Futures on VIX allow you to hedge your risks, earning on fluctuations in asset prices and expectations of sharp market movements. As strong market movements are very difficult to predict over a long period of time, short futures are of interest. But to buy them all the time.
and it’s expensive and time-consuming to move on. This function is performed by VXX ETN.
WHAT FOR THE S&P 500
The shares of thousands of companies are traded on stock exchanges. On the basis of 500 U.S. joint stock companies with the largest capitalization, the company
Standard & Poor’s calculates the S&P 500 index.
Options are traded on the S&P 500 index. On the basis of the options on the S&P 500 index, the VIX index (also known as the volatility index or fear index) is calculated.
Futures are traded on the VIX index. Futures for VIX are packaged on the iPath S&P 500 VIX Short-Term Futures ETN, which is directly correlated with the S&P 500.
with index VIX.
Well, as they say, welcome and good luck!