Since October, when the head of the Federal Reserve Jerome Powell said that the rate is “far from neutral”, shares of the U.S. and global companies have adjusted by more than 10%. Oil prices collapsed by 35%, while the dollar continued to rise.
and now 8% above its February low.
The SPDR financial sector lost 11% from its high of October 1. Sectors such as housing, transportation, industry, and small capitalization equities are declining in double-digit percentage terms, well below the S&P 500 and Dow Jones. All this is causing market participants to panic, so let’s look at why this is happening.
and what is it, a yield inversion.
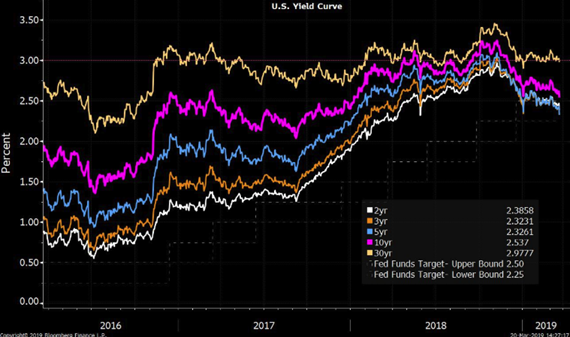
The yield curve is the difference between the annual yield of long-term and short-term US Treasury bonds.
When the latter turns out to be more profitable than the former (“concave curve”), it is not a good sign: investors become skeptical.
Usually, a “concave curve” is followed by a recession, but so far only a curve between two- and five-year bonds has “concave”,
with a horizon of up to ten years.
Analysts are urgently reducing their profit forecasts. All 11 sectors of the S&P 500 have received a decline in expected profit growth in recent months,
led by utilities, raw materials and industrial enterprises. The industrial sector was among the most affected.
in terms of a downward revision of income estimates. Estimates of 4Q earnings fell to 14.5% from 20.7% at the beginning of the quarter.
According to Citigroup’s estimates, in 2019 the market estimated a 1% decline in profits. The majority on Wall Street expect about 8% profit growth.
The reason is in anticipation of recession in mid-2020.
There are many signs that indicate a sharp slowdown in economic growth in the coming months, and share prices may be even more vulnerable to selling pressure. Historically, one of the main signs of recession is the inversion of the US bond yield curve. That’s what we’ll talk about in more detail.
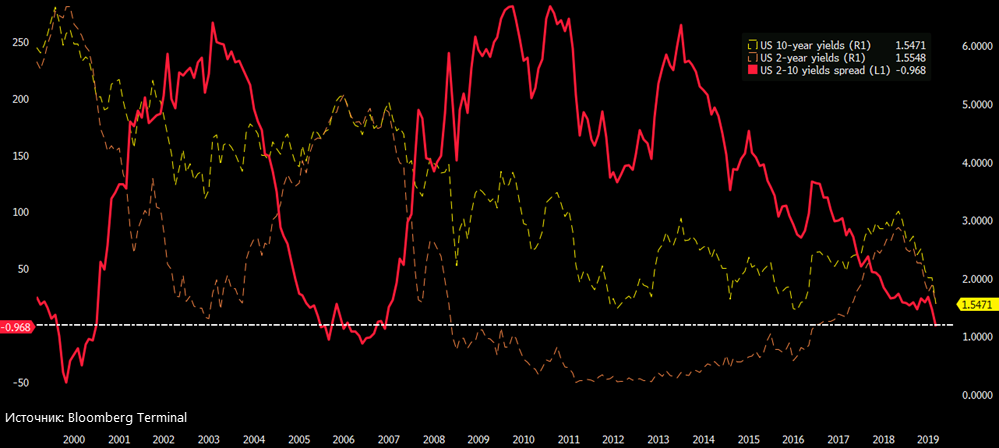
Few people may have noticed, but I will remind you that sales in global markets began at a time when the spread between two years
and decades was at its lowest since 2008, and the yield gap between them went into negative territory for the first time since 2007. In general, the inversion of the US bond yield curve is an important and rare event: the last year the US government bond yield curve has become more and more flattened, and now shows a partially inverted character. It is quite possible that in the next six months the yields of two-year bonds may overtake ten-year bonds. There have been 7 recessionary periods in the US over the last 50 years and each of them was preceded by a similar inversion. The time lag is between 6 months and two years.
The yield is usually higher on fixed-income securities with longer maturities. A negative yield curve (or inversion curve) is characteristic of the interest rate situation, in which long-term debt instruments have a lower yield,
than short-term debt instruments of the same credit quality. And the partial inversion (which we now see) occurs when only some of the short-term treasury bonds (five or ten years) have a higher yield than 30-year treasury bonds.
THE FORM OF THE YIELD CURVE CHANGES IN PROPORTION TO THE STATE OF THE COUNTRY'S ECONOMYDuring certain periods of economic cycles (usually at the end of an upturn) a smoothing of the yield curve may occur. Yield curve smoothing is a change in the yield curve where the spread (difference) between long-term and short-term treasury bonds’ yields is reduced.
As the economy moves towards recession, knowing that interest rates are falling, investors are more inclined to invest in long-term securities immediately to fix the current higher yields. This in turn increases the demand for long-term securities, raises their prices and further reduces their profitability. Meanwhile, few investors want to invest in short-term securities when they are represented with lower reinvestment rates. With a decrease in demand for short-term securities, their yield actually increases, which leads to a reversal of the yield curve.
AS WAS THE CASE IN 2008
Before and after the crisis.
Briefly: before the crisis, the yield curve is normal, then there is a smoothing of the curve, and before the crisis – inversion. Then the curve in response to the Fed’s monetary policy easing and interest rate cuts is back to normal. If the curve is normal, it means that bond market participants expect the economy to accelerate and interest rates to grow further. Normal tilt will increase over time, as longer term rates should be higher than short-term rates.
The longer the period for which the investor invests, the greater the risk he takes, and therefore the greater the interest he wants to receive. Accordingly, for bonds with a longer term maturity, the yield will be slightly higher than for short-term bonds. Since investors are supposed to be rewarded for not consuming immediately and to be compensated for the additional uncertainty and high volatility of long-term bonds.
That’s how the theory describes the situation. But in reality we have the fact that for the first time in 10 years the difference between the Federal Reserve’s rate and consumer inflation has reached the positive territory. I mean, the stakes have really gone positive. The growth of real interest rates occurs when the growth of nominal rates outpaces inflation. Or when inflation falls faster than nominal interest rates.
As a rule, the growth of the yield curve has always been due to the fall in interest rates on short-term bonds due to the stimulus actions of the Federal Reserve. Now the Fed is tightening its policy and the growth of the yield curve is likely to come at the expense of faster growth of rates on long bonds. Reason? Projected dollar liquidity deficit…